Technical Analysis for Crypto
How can Technical Analysis be applied to the cryptocurrency market?
Technical analysis can be a valuable tool for analyzing the cryptocurrency markets, including popular cryptocurrencies like Bitcoin and Ethereum.
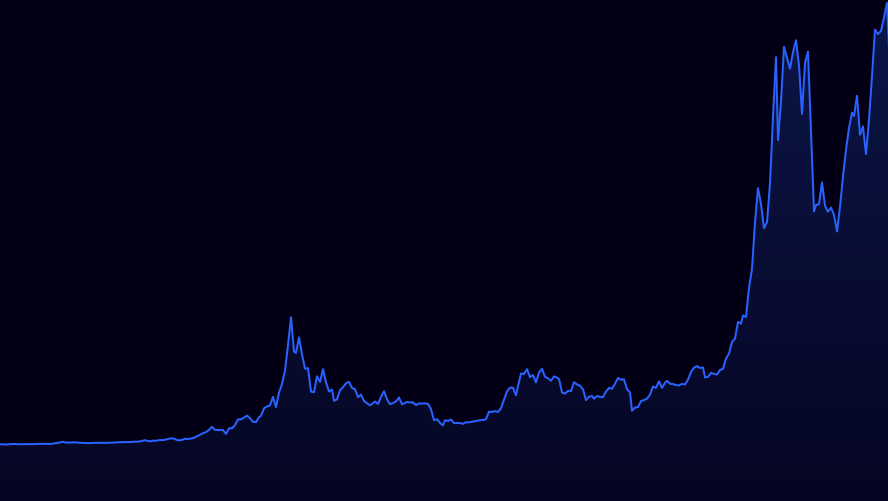 By studying historical price patterns and indicators, traders and investors can gain insights into potential price movements and make more informed decisions. For instance, when examining Bitcoin's price chart, analysts often look for patterns such as support and resistance levels, trend lines, and chart formations to identify potential buying or selling opportunities.
These patterns can provide indications of market sentiment and potential price reversals, allowing traders to adjust their positions accordingly.
By studying historical price patterns and indicators, traders and investors can gain insights into potential price movements and make more informed decisions. For instance, when examining Bitcoin's price chart, analysts often look for patterns such as support and resistance levels, trend lines, and chart formations to identify potential buying or selling opportunities.
These patterns can provide indications of market sentiment and potential price reversals, allowing traders to adjust their positions accordingly.
Indicators & formulas
Traders often utilize various technical indicators, such as moving averages, relative strength index (RSI), and Bollinger Bands, to assess Ethereum and Bitcoin's price trends and market conditions.
These indicators can help identify overbought or oversold conditions, potential trend reversals, and signals for entry or exit points in the market. Additionally, analyzing trading volume alongside price movements can offer further insights into the strength of trends and the participation of market participants. By combining multiple technical analysis techniques and indicators, traders can develop strategies to navigate the volatile cryptocurrency markets.